A 25 basis points interest rate cut from the U.S. Federal Reserve is expected to be announced later on Wednesday. With Bitcoin (BTC) trading close to the crucial $117,500 resistance level, the question is whether this decision will ignite a strong rally or simply turn into a “sell the news” event.
All Signs Point Toward the Next Big Rally
Momentum around Bitcoin is building rapidly. The Trump administration is in the process of setting up a Strategic Bitcoin Reserve (SBR), more corporations are allocating Bitcoin into their balance sheets, and U.S. Spot Bitcoin ETFs have collectively accumulated roughly 25,000 BTC just since last week. If a Fed rate cut is thrown into the mix, the conditions could be perfectly aligned for Bitcoin’s next major upward surge.
Small Bull Flag Pattern Forming – Volatility Likely
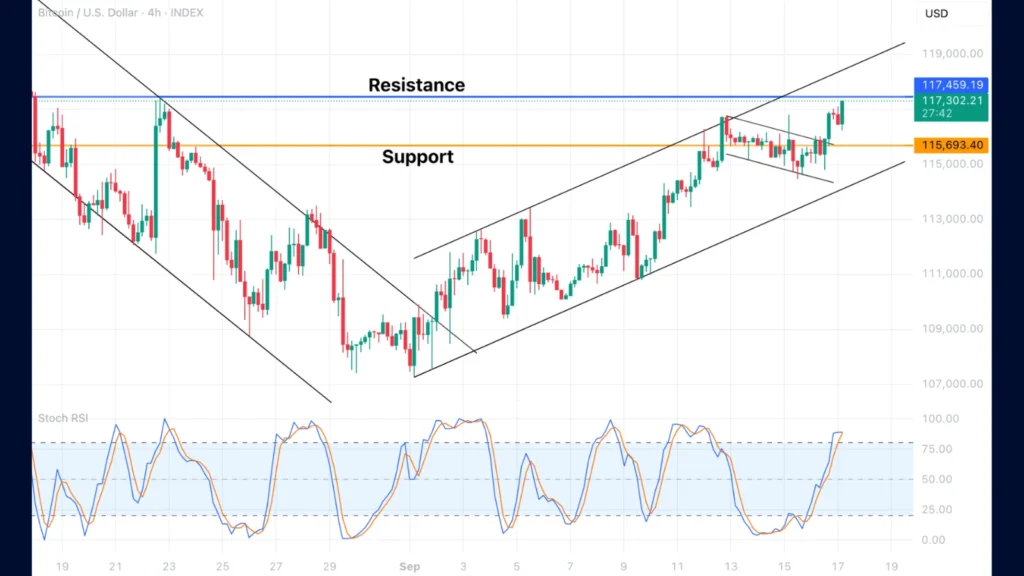
Source: TradingView
On the short-term chart, Bitcoin’s price appears to be nearing what may be the final major resistance before attempting to retest its all-time high of $124,000.
The cryptocurrency has already broken out of the upper side of a small bull flag, and this breakout may be fueling a measured move that targets around $120,000—the last key resistance zone standing in the way of reclaiming the ATH.
While it looks like a smooth path forward, traders should be cautious. Significant volatility could strike today. Unlike traditional financial markets, crypto market makers aren’t restricted by strict regulations, giving them the freedom to manipulate price action before, during, and after the Fed’s announcement. This could trigger sudden spikes both upward and downward, liquidating leveraged long and short positions alike.
Inverse Head and Shoulders Suggests $120,000 Target
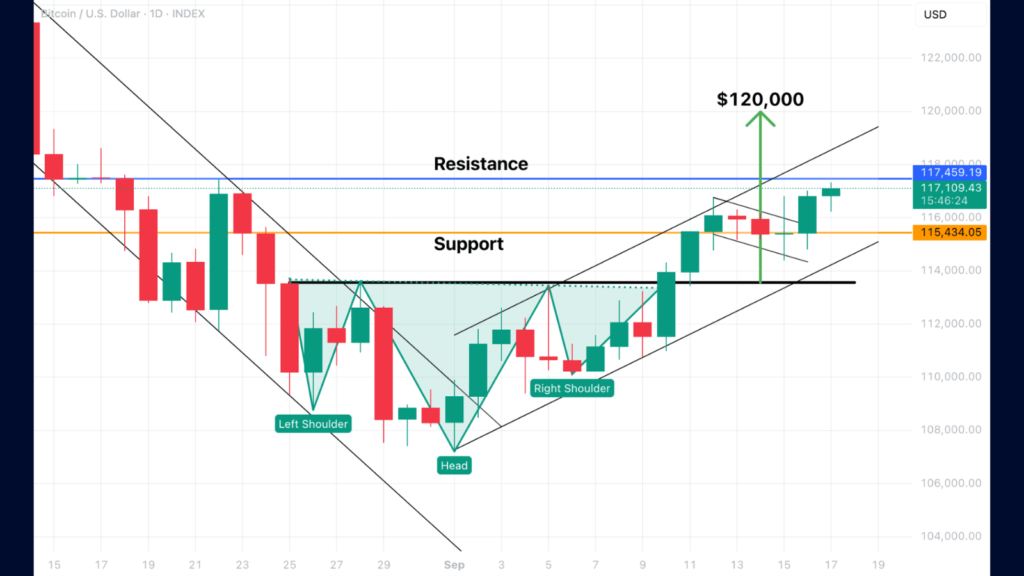
Source: TradingView
On the daily chart, Bitcoin is also showing another bullish setup: an inverse head and shoulders pattern.
The price has already broken through the neckline and confirmed it as new support. Since then, BTC has been trending higher. All it needs now is a breakout above horizontal resistance and the upper channel boundary to complete its measured move toward $120,000.
Could This Be a Larger Bull Flag?
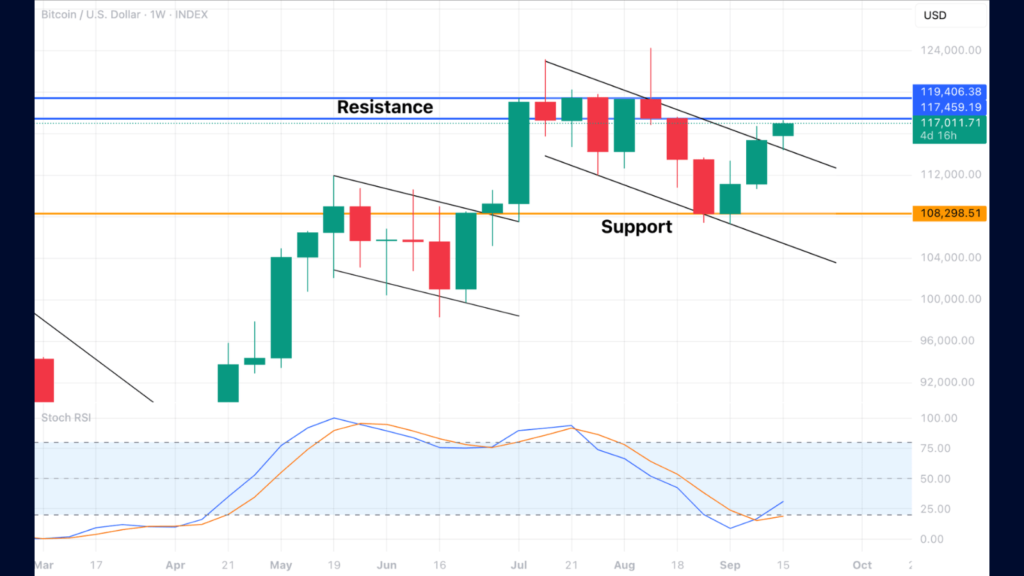
Source: TradingView
Zooming out to the weekly chart gives a clearer picture of Bitcoin’s structure. For the last 10 weeks, the price action seems to have been forming a large bull flag. The brief break above the all-time high could be seen as a fakeout, given that the candle body remained inside the flag’s structure.
What makes this moment particularly exciting is that the flag has already broken to the upside, and this week’s candle looks like it may be confirming that breakout.
Compared to the smaller bull flag and the inverse head and shoulders on lower timeframes, this larger bull flag is a much more powerful pattern. If it plays out fully, the measured move points toward a potential rally to $130,000.
Hold tight—things could get very interesting.