With the U.S. Federal Reserve delivering the anticipated rate cut on Wednesday, altcoins are now competing for momentum to ride the potential upswing in the crypto market. Among the frontrunners is Solana ($SOL), one of the strongest-performing altcoins. The big question now—can Solana bulls overcome resistance and push the price back toward its record highs?
$SOL Hovering Just Below Crucial Horizontal Resistances
Source: TradingView
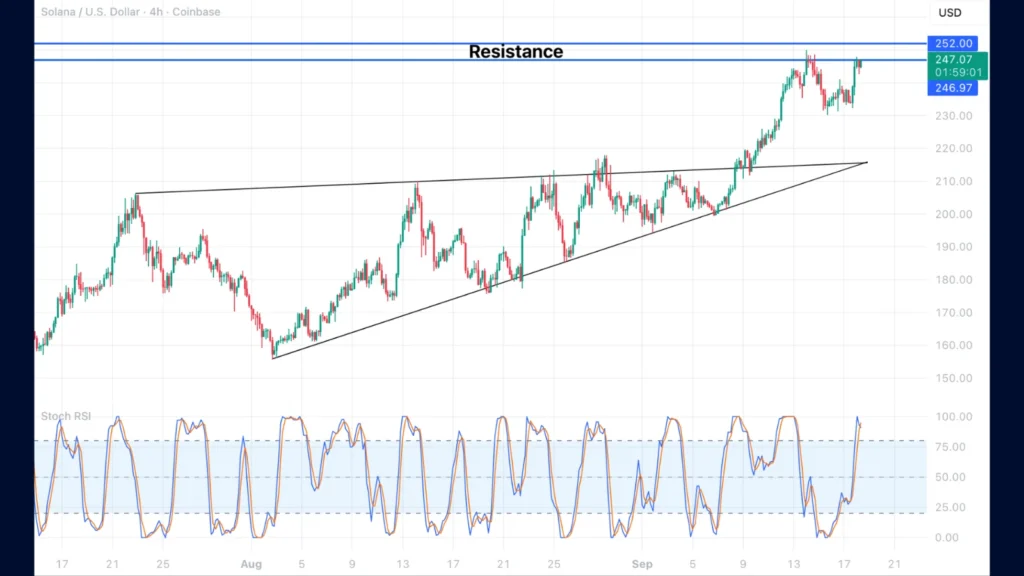
On the short-term chart, Solana’s price is sitting just under its first resistance level at $247. Directly above lies the key resistance at $252, followed by another minor barrier at $260 before reaching the all-time high of $295.
The chart also highlights that $SOL has previously broken out of a wedge formation. The projected move from this breakout has yet to be fulfilled, and its target extends beyond the resistance levels, reaching around $266.
Fibonacci Analysis Highlights $252 as a Vital Resistance
Source: TradingView
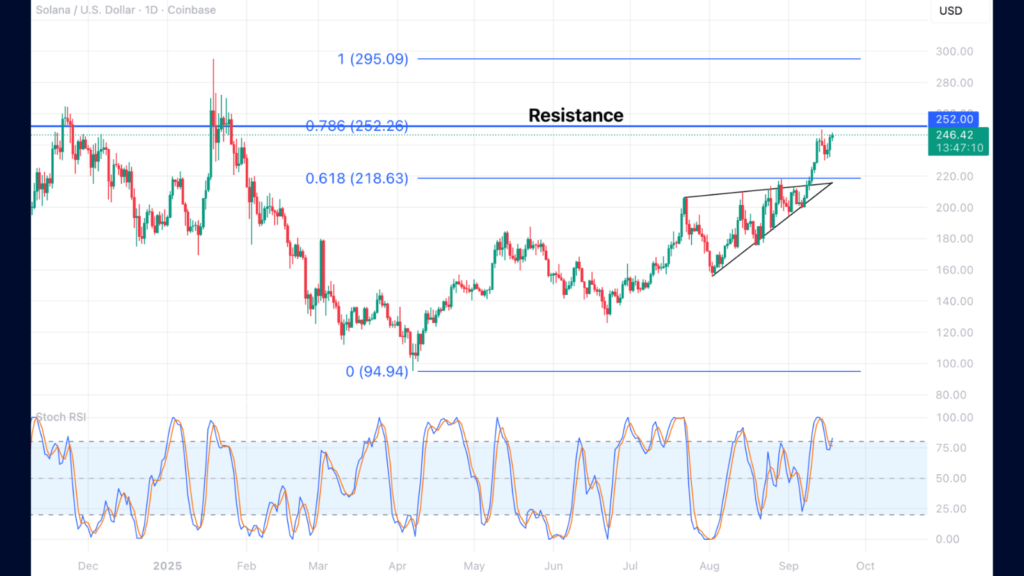
Looking at the daily time frame, when applying the Fibonacci extension from the all-time high down to the local bottom near $95, the 0.786 Fibonacci retracement level aligns precisely with the $252 horizontal resistance. This confluence underscores why $252 is such a critical level for $SOL to surpass.
$SOL Bull Market Targets on the Horizon
Source: TradingView
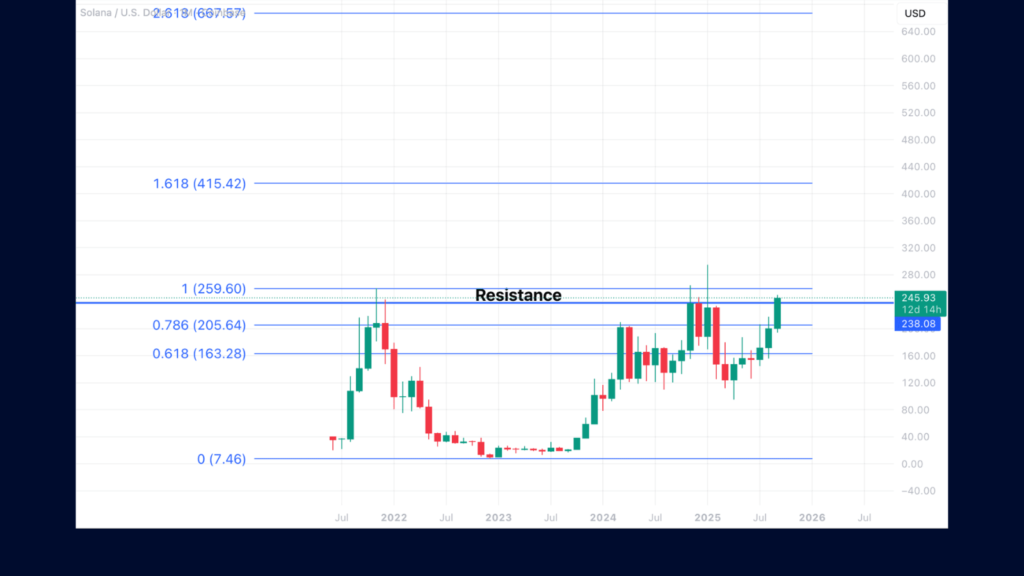
Zooming out to the monthly time frame, the chart shows that the real candle body resistance sits at $238—a level Solana has already crossed. If the current monthly candle closes above this threshold, it could set the stage for a bullish continuation.
The Fibonacci extension levels suggest possible future targets for $SOL at $415 and even as high as $667, should momentum carry forward.